

Introduction: The Solar Farm Investment Landscape in 2026
The renewable energy sector has reached an inflection point. What once attracted only early-stage venture capital and government incentives now commands the attention of institutional asset managers worldwide. Investing in solar farms has transformed from a speculative environmental play into a mature, bankable asset class with performance metrics that rival traditional infrastructure investments.
This evolution didn’t happen overnight. Over the past decade, solar panel costs have plummeted by more than 80%, making utility-scale projects financially competitive without subsidies in most markets. Meanwhile, corporate sustainability mandates have accelerated dramatically. Tech giants, manufacturers, and Fortune 500 companies aren’t just setting renewable energy targets—they’re signing 20-year power purchase agreements that create predictable cash flows for project developers and investors alike.
Policy tailwinds continue strengthening the investment thesis. The Inflation Reduction Act extended and enhanced tax credits for renewable energy projects, while state-level renewable portfolio standards keep expanding their targets. Internationally, Japan, the European Union, and emerging markets are deploying capital at unprecedented rates to meet their climate commitments.
Hudson Sustainable Group has been at the forefront of this transformation. Since our founding, we’ve deployed over $13 billion across our renewable energy portfolio, achieving a lifetime internal rate of return exceeding 31%. These aren’t hypothetical projections—they’re realized returns from real projects operating across 26 countries. Our track record demonstrates that environmental stewardship and superior financial performance aren’t mutually exclusive.
For institutional investors and high-net-worth individuals, the opportunity extends beyond simple equity stakes. Today’s solar farm investment landscape offers multiple entry points: direct project ownership, fund vehicles, tax equity structures, and debt instruments. Each approach carries distinct risk-return profiles suited to different investor mandates and portfolio strategies.
This comprehensive guide demystifies commercial solar investment from the ground up. We’ll walk through financial modeling frameworks that institutional investors actually use, explore development processes from site selection through commissioning, examine risk mitigation strategies that protect capital, and outline practical entry strategies for investors at various scales. Whether you’re evaluating your first renewable energy allocation or expanding an existing infrastructure portfolio, understanding the mechanics of solar farm investments has never been more essential—or more financially compelling.
Understanding Solar Farm Investment Models and Structures
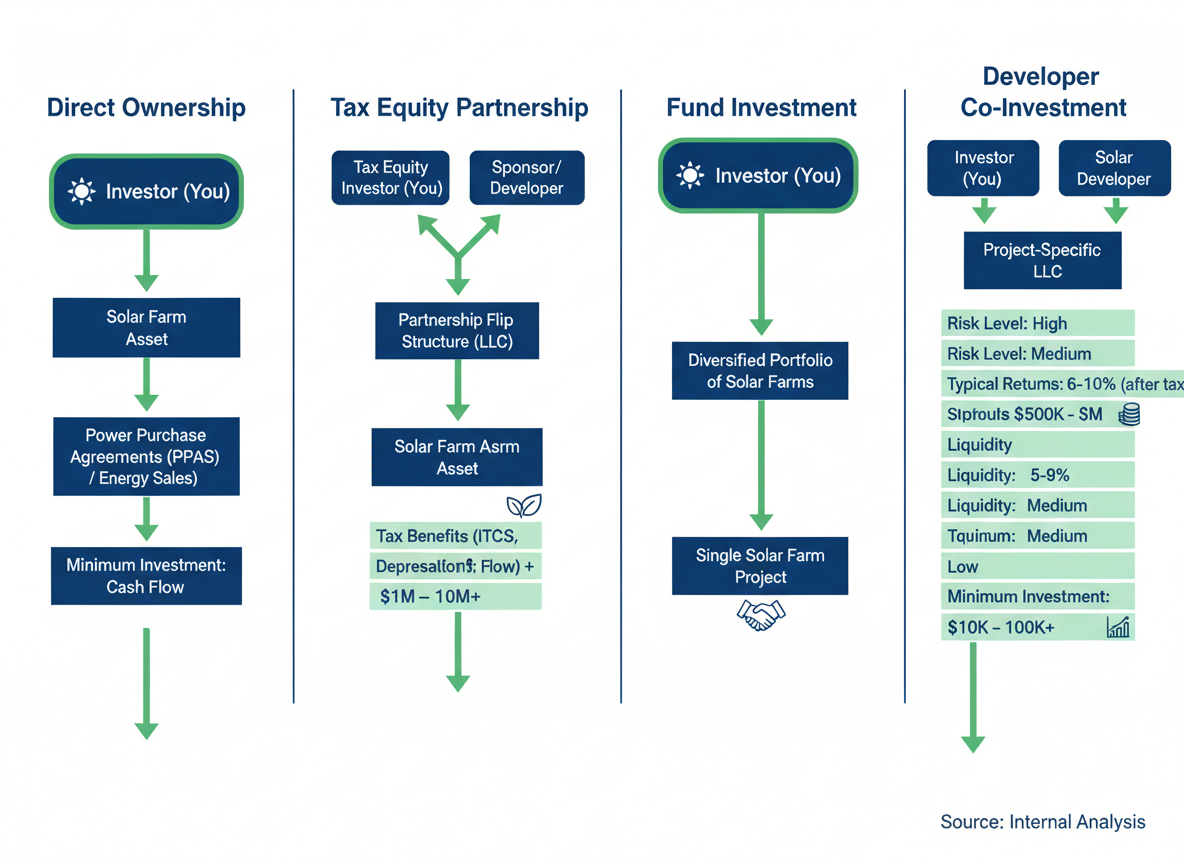
Investing in solar farms isn’t one-size-fits-all. The market offers multiple entry points, each with distinct characteristics that’ll shape your returns, risk profile, and involvement level.
Direct Ownership vs. Structured Approaches
Direct ownership means you’re buying the asset outright—the solar panels, inverters, land rights, and power purchase agreements. You control decisions and capture all cash flows, but you’re also shouldering operational responsibilities and technology risk. It’s capital-intensive, typically requiring $5M to $50M minimum for a single project, and demands in-house expertise or strong partnerships.
Project finance structures flip this dynamic. You’re providing debt or equity capital to a special purpose vehicle that owns the solar farm. This arrangement limits your exposure to a single asset while offering defined returns through debt service or equity distributions. Many institutional investors prefer this route because it aligns with their risk management frameworks.
Fund investment structures bundle multiple projects into a diversified portfolio. You’re investing alongside other limited partners, gaining exposure to 10-30 solar farms across different regions and off-takers. Minimum commitments typically start at $10M, with larger funds requiring $50M+. The trade-off? Management fees and less direct control, but you’re getting professional asset management and geographic diversification.
Utility-Scale vs. Community Solar Characteristics
Utility-scale projects—those 5MW installations and larger—offer economies of scale and long-term contracts with investment-grade utilities or corporations. These are the bread-and-butter of institutional solar investment, with proven cash flow models and established financing markets.
Community solar presents different dynamics. Projects are smaller (typically 1-5MW), serve multiple subscribers rather than a single off-taker, and face customer acquisition costs that utility-scale doesn’t. However, they can deliver premium returns in markets with favorable net metering policies and strong residential demand.
Tax Equity and ITC Optimization
This is where solar investment gets sophisticated. The Investment Tax Credit allows you to claim 30% of project costs as a federal tax credit, with additional adders for domestic content and energy communities. The IRA clean energy tax incentives have significantly enhanced these opportunities.
Tax equity structures—partnership flips, inverted leases, and sale-leasebacks—monetize these credits efficiently. You’ll need substantial tax liability to benefit directly, which is why corporations like banks and insurance companies dominate this space. If you can’t use the credits yourself, you’re likely partnering with someone who can.
Public Market Vehicles and Yieldcos
Yieldcos emerged as publicly-traded entities holding portfolios of operating renewable energy assets. They offer liquidity that direct investments can’t match—you can sell shares tomorrow if needed. However, you’re accepting market volatility and limited influence over asset management decisions.
Partnership Models That Work
Developer partnerships let you invest earlier in the project lifecycle, often acquiring assets at lower valuations in exchange for development risk. Joint ventures split ownership and control, ideal when you want influence but not full responsibility. Minority stakes (15-35% ownership) offer exposure with reduced capital requirements, starting around $5M depending on project size.
Investment Horizons and Exit Planning
Most solar farm investments target 7-15 year hold periods. That’s when debt’s paid down, tax benefits are optimized, and asset value stabilizes. Exit strategies include selling to infrastructure funds, rolling up projects into larger portfolios, or refinancing to pull out equity while maintaining ownership. The secondary market for operating solar assets has matured considerably, giving investors multiple exit pathways they didn’t have a decade ago.
Financial Returns and ROI Analysis for Solar Farm Investments
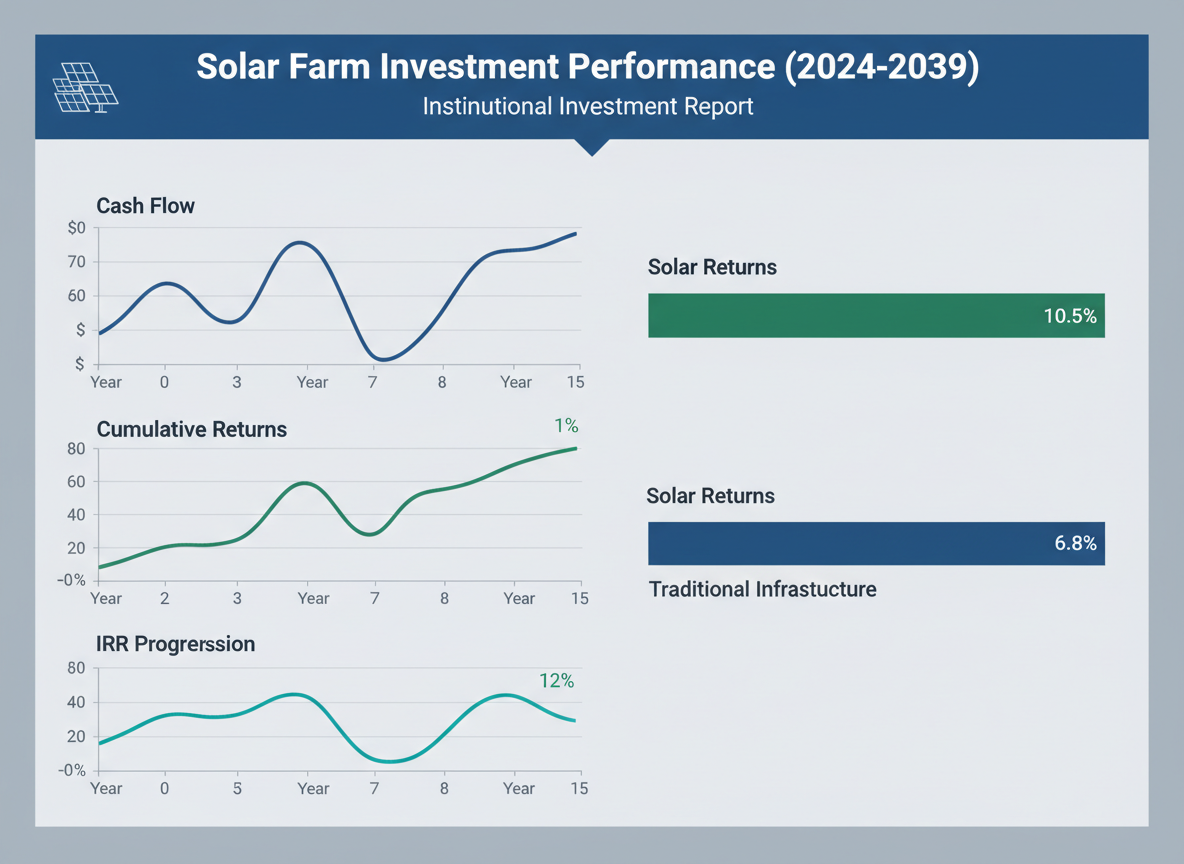
When you’re considering investing in solar farms, understanding the financial mechanics separates successful investments from missed opportunities. The returns vary significantly based on project maturity, risk profile, and deal structure—but the numbers tell a compelling story.
Stabilized solar assets typically deliver internal rates of return between 8-15%. These are operational facilities with long-term contracts in place, offering predictable cash flows similar to bonds but with equity-like upside. Development-stage projects, which carry higher risk during construction and permitting, can generate IRRs of 15-25% or higher for investors willing to navigate pre-operational complexities.
How Solar Farms Generate Revenue
Solar farm returns come from three primary sources. Power Purchase Agreements (PPAs) form the foundation—these are long-term contracts, often 15-25 years, where utilities or corporations agree to buy electricity at fixed rates. They’re the closest thing to guaranteed income in the renewable sector. Merchant sales, where electricity is sold at market rates, offer higher potential returns but introduce price volatility. Then there’s the third leg: Renewable Energy Credits (RECs), which represent the environmental value of clean power generation and can be sold separately from the electricity itself.
The cash flow profile follows a distinct pattern. During construction, investors typically see negative cash flow as capital gets deployed. Once operational, there’s a stabilization period of 6-12 months where systems are optimized and revenue ramps up. After that, you’ll see consistent quarterly distributions for the duration of the asset’s 25-30+ year operational life.
Key Metrics That Matter
Sophisticated investors focus on specific metrics beyond simple IRR. The levelized cost of energy (LCOE) measures the per-kilowatt-hour cost of building and operating a plant over its lifetime—essentially the break-even price. Lower LCOE means higher profitability margins when selling power.
Capacity factor reveals how efficiently a facility operates compared to its maximum potential. While fossil fuel plants might achieve 60-80% capacity factors, solar farms typically run between 20-35% depending on location and technology. That’s not a weakness—it’s just the nature of solar production, and it’s already baked into financial models.
Debt service coverage ratios (DSCR) indicate how comfortably cash flows cover loan payments. Lenders typically want to see ratios above 1.20x, meaning the project generates at least 20% more cash than needed for debt obligations.
Tax Benefits That Boost Returns
Federal tax incentives dramatically improve solar investment economics. The Investment Tax Credit (ITC) currently allows investors to claim 30% of project costs as a tax credit. Modified Accelerated Cost Recovery System (MACRS) depreciation lets you depreciate 85% of the project’s cost basis over just five years. Combined, these benefits can reduce the effective cost of a solar investment by 40-50% for tax-paying entities.
Comparing to Traditional Alternatives
How does this stack up? Core real estate funds typically target 8-12% returns. Infrastructure debt yields 4-7%. Private equity infrastructure funds aim for 12-18%. Solar investments sit right in the sweet spot—offering infrastructure-like stability with private equity-like returns, all while contributing to the energy transition.
The Sky Solar portfolio demonstrates what’s possible with strategic positioning. Hudson Sustainable Group achieved a 31%+ lifetime IRR through early-stage entry, active asset management, and optimal exit timing. That’s not typical—it required specialized expertise and market timing—but it shows the upside potential when investing in solar farms with the right strategy and team.
The key is matching your risk appetite with the appropriate project stage while understanding exactly where returns come from and what metrics signal success.
The Solar Farm Development Process: From Site Selection to Interconnection
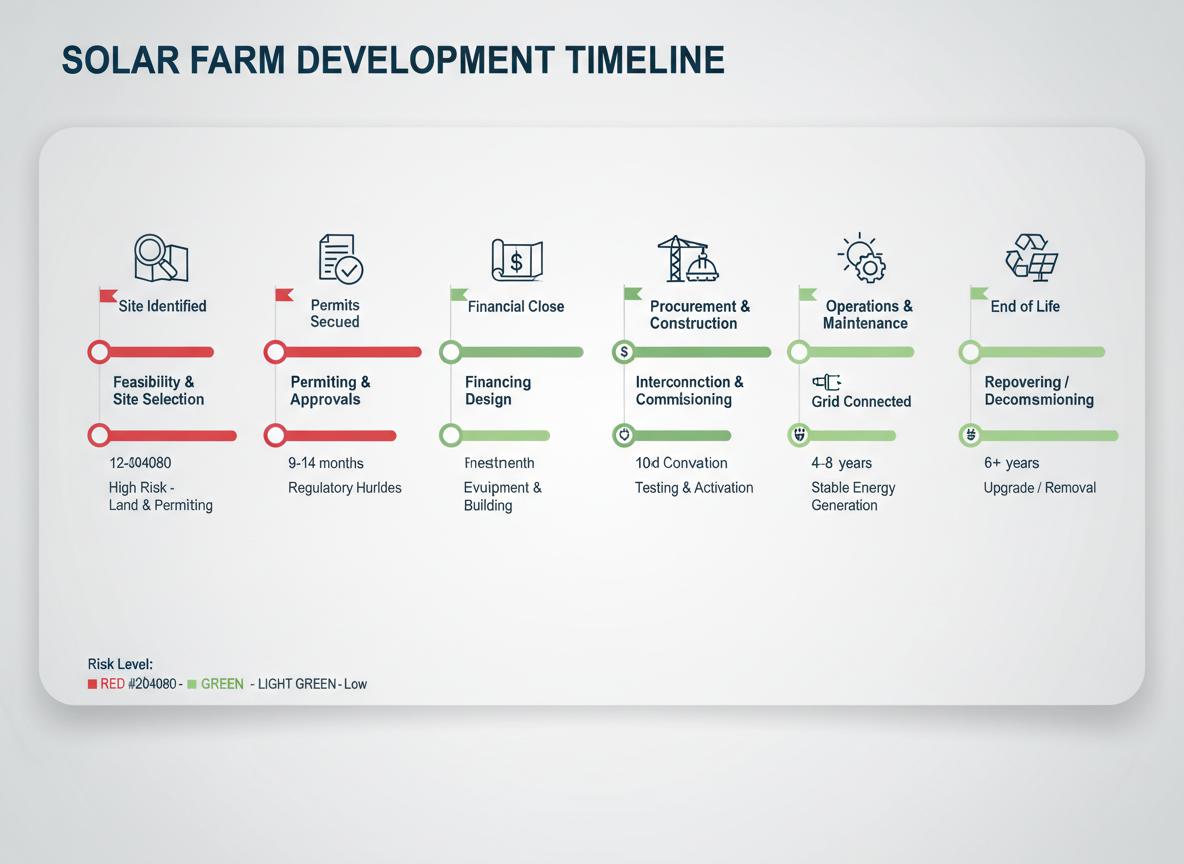
Investing in solar farms requires understanding a complex development process that transforms raw land into revenue-generating assets. The journey from initial site identification to commercial operation typically spans 24 to 48 months, with each phase presenting distinct challenges and opportunities that can significantly impact project economics.
Phase 1: Site Identification and Land Requirements
The foundation of any successful solar farm starts with proper site selection. As a general rule, you’ll need 5 to 10 acres per megawatt of installed capacity—though actual requirements vary based on technology choice and site topography. A 50 MW facility, for instance, typically occupies between 250 and 500 acres.
Prime locations share several characteristics: relatively flat terrain (ideally less than 5% slope), minimal shading, strong solar irradiance levels, and—most importantly—proximity to transmission infrastructure. Sites within a mile of suitable transmission lines dramatically reduce interconnection costs, which can otherwise become project killers.
Phase 2: Feasibility Analysis
Before committing significant capital, developers conduct rigorous feasibility studies examining three critical factors. Solar irradiance data, collected over multiple years, determines expected energy production. You’re looking for areas receiving at least 4.5 peak sun hours daily, though locations with 5.5+ hours deliver optimal returns.
Grid proximity matters enormously. A site might receive abundant sunshine but prove uneconomical if it’s ten miles from adequate transmission infrastructure. Equally important is available transmission capacity—many otherwise excellent sites sit in congested grid areas where interconnection queues stretch years into the future.
Environmental considerations complete the feasibility picture. Wetlands, endangered species habitats, and archaeological sites can derail projects entirely or add substantial mitigation costs.
Phase 3: Land Acquisition Strategies
Most developers opt for long-term ground leases rather than outright purchases, preserving capital for actual construction. Typical lease terms span 20 to 30 years with options for extensions, often structured with escalating payments that start around $500 to $1,500 per acre annually, depending on location and market conditions.
Landowners typically receive lower payments during development phases, then higher rates once projects reach commercial operation. Some agreements include percentage-of-revenue structures, aligning landowner interests with project performance.
Purchase models make sense in specific scenarios—particularly for developers building portfolios in high-value markets or when landowners prefer one-time payments. However, the upfront capital requirements significantly impact project IRR calculations.
Phase 4: Permitting and Regulatory Approvals
This phase often determines whether you’re looking at a 30-month or 50-month development timeline. You’ll navigate multiple approval layers simultaneously: local zoning and special use permits, state environmental reviews, and federal permits if you’re on government land or affecting protected resources.
Utility interconnection agreements represent perhaps the most critical approval. The process involves formal applications, system impact studies, and negotiations over upgrade costs. In some regions, interconnection alone consumes 18 to 24 months.
Community engagement can’t be overlooked. Projects that proactively address local concerns typically move through approvals faster than those facing organized opposition.
Phase 5: Engineering Design and Equipment Procurement
With permits secured, detailed engineering begins. This phase transforms conceptual layouts into construction-ready designs, specifying everything from panel tilt angles to inverter placement and cable routing.
Equipment procurement timing matters enormously. Lead times for panels, inverters, and transformers fluctuate with market conditions—sometimes stretching six months or longer. Savvy developers lock in pricing and delivery schedules well before breaking ground, hedging against both cost increases and supply chain disruptions.
Projects like First Solar 2 demonstrate how proper engineering and procurement strategies translate conceptual plans into operational assets generating consistent returns.
Phase 6: Construction Timeline
Once shovels hit dirt, utility-scale solar farms typically require 9 to 18 months to complete, depending on size and complexity. A well-orchestrated construction sequence moves through site preparation, foundation installation, racking assembly, module mounting, electrical installation, and finally, testing and commissioning.
Weather patterns significantly influence construction schedules. Projects in regions with harsh winters often pause during certain months, extending overall timelines but not necessarily increasing costs proportionally.
Phase 7: Commissioning and Grid Interconnection
The final sprint involves comprehensive testing of all systems, verification of performance metrics, and formal grid interconnection. This phase typically requires 30 to 60 days and culminates in the utility’s authorization to begin commercial operation—the moment when your investment starts generating actual revenue.
Understanding Critical Path Items
Several factors consistently cause development delays. Interconnection queue backlogs top the list, particularly in high-growth markets. Environmental permitting for sites with wetlands or endangered species adds months or years. Supply chain disruptions, while less predictable, can stall otherwise ready-to-build projects.
Experienced developers build contingency timelines and maintain flexibility in their portfolios, advancing multiple projects simultaneously to ensure consistent deployment despite inevitable site-specific challenges.
Technical Specifications and Technology Considerations
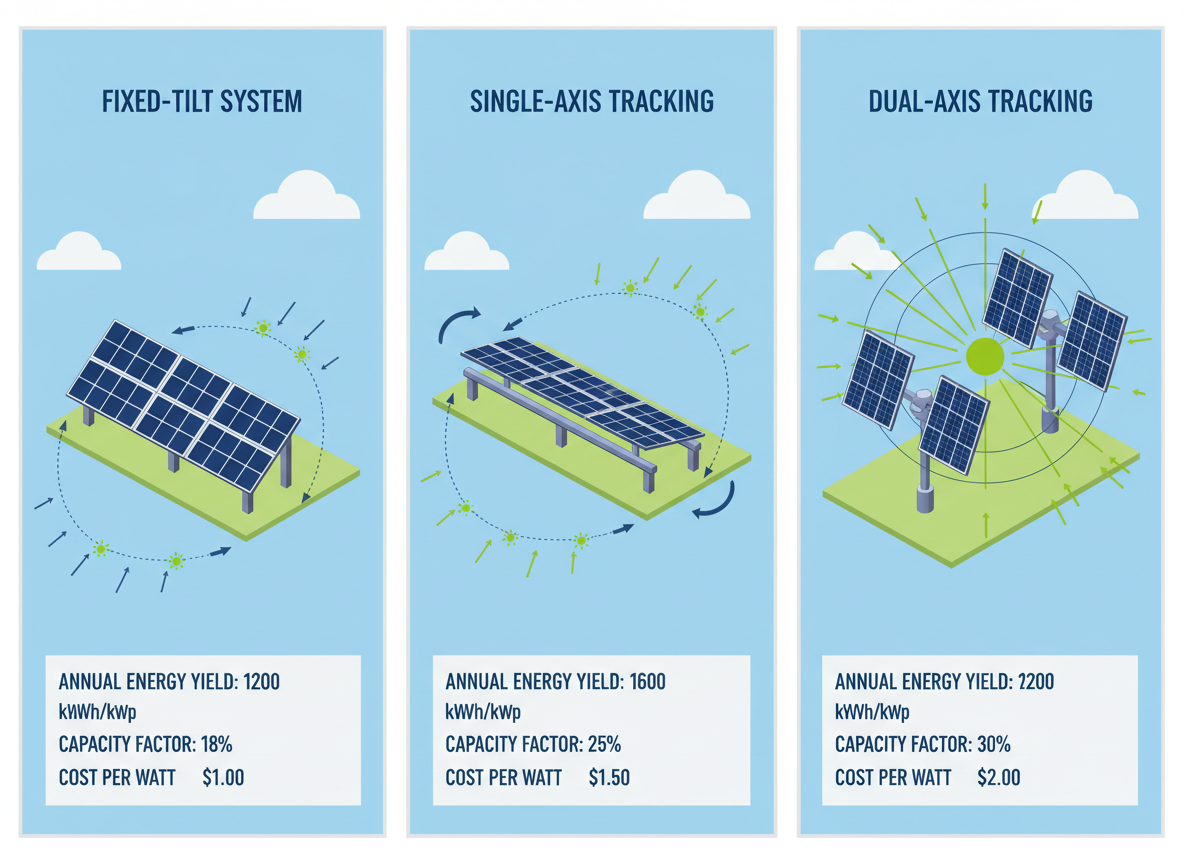
When you’re investing in solar farms, understanding the equipment matters just as much as the financials. The technology you choose directly impacts energy production, maintenance costs, and long-term returns. Let’s break down what actually makes a difference.
Panel Technology: Beyond the Marketing Claims
The solar panel market has consolidated around three main technologies, each with distinct trade-offs. Monocrystalline panels—those sleek black squares you’ll see on most modern installations—dominate the commercial market for good reason. They deliver 20-22% efficiency as standard, with premium models pushing 22-25%. That means more power from less space, which matters when you’re optimizing land use.
Polycrystalline panels cost less upfront but sacrifice 1-2% in efficiency. They’ve lost market share as monocrystalline production costs have dropped. Thin-film technology offers flexibility and better performance in high temperatures, but its lower efficiency (15-18%) means you’ll need more acreage to hit the same capacity.
Here’s what most investors miss: the difference between 20% and 22% efficiency compounds over 25 years. That extra 10% production boost directly increases your project IRR, often justifying the premium price.
Tracking Systems: When Movement Pays Off
Fixed-tilt systems are simple and reliable. You mount the panels at an optimized angle, and they sit there for decades. Single-axis trackers rotate east to west, following the sun’s path and boosting energy capture by 15-25% compared to fixed systems. Dual-axis trackers add north-south movement, squeezing out another 5-10% gain.
The catch? Single-axis systems add roughly $0.05-0.08 per watt to installation costs, while dual-axis systems can double that premium. You’re also introducing mechanical components that require maintenance. Most utility-scale projects opt for single-axis tracking because the production gains justify the added complexity. Fixed-tilt makes sense in regions with inconsistent weather or space constraints.
The Supporting Cast
Inverters convert DC power to AC electricity that feeds the grid. String inverters serve multiple panels, while microinverters optimize each panel individually. Central inverters dominate utility-scale installations—they’re more cost-effective at scale and easier to maintain. Projects like Addenium Solar demonstrate how proper system design maximizes inverter efficiency across varying conditions.
Balance of system components—racking, wiring, monitoring systems—represent 20-30% of total project costs. Skimping here creates problems later. Quality racking systems withstand 30+ years of wind loads. Smart monitoring catches performance issues before they crater your energy production.
Planning for the Long Haul
Modern panels degrade at 0.5-0.8% annually. That’s slower than older technology, but it means a 25-year-old system produces 80-88% of its original capacity. Factor this degradation into your financial models from day one.
Equipment warranties matter, but only if the manufacturer survives. Tier 1 manufacturers with strong balance sheets will honor 25-year warranties. Lesser-known brands offering similar terms might disappear in five years, leaving you with worthless paper guarantees.
The technology landscape shifts quickly, but the fundamentals don’t. Choose proven equipment, size your system conservatively, and focus on long-term reliability over bleeding-edge efficiency claims.
Risk Assessment and Mitigation Strategies
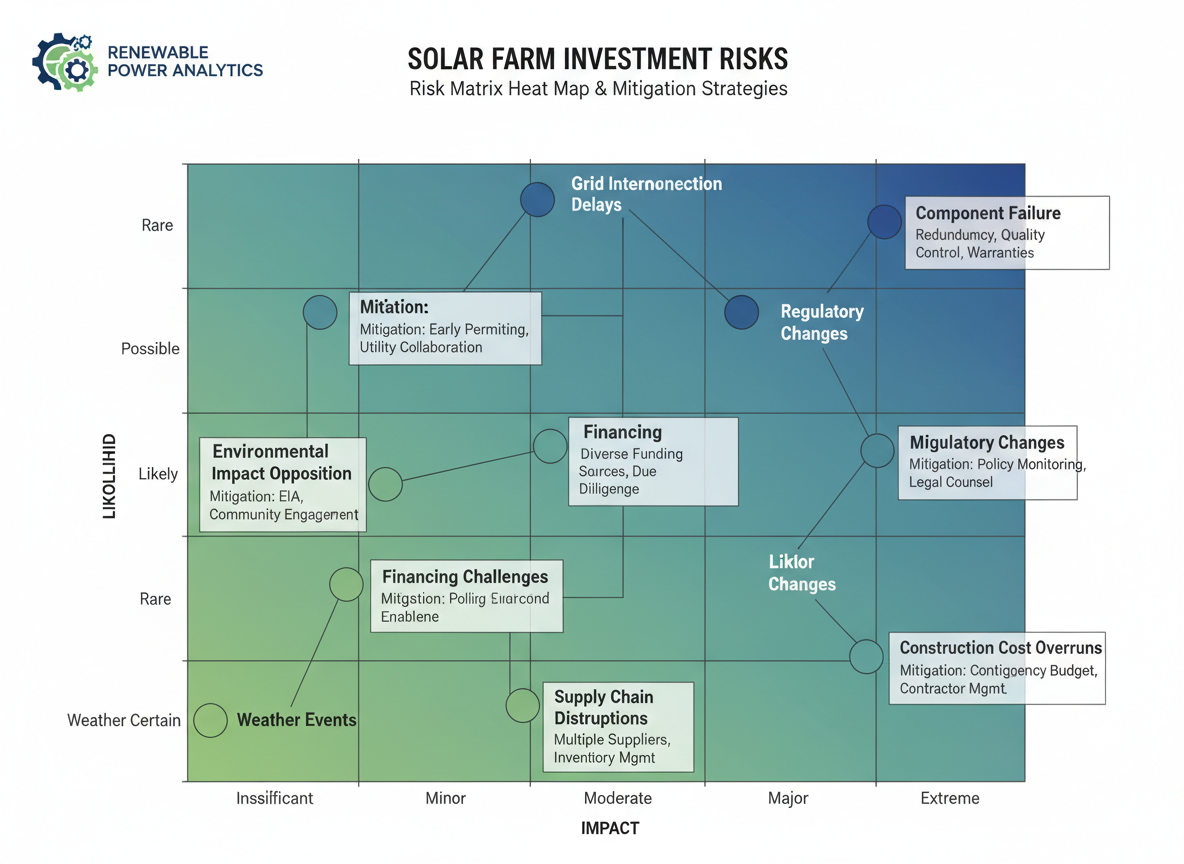
When you’re investing in solar farms, understanding the risk landscape isn’t optional—it’s fundamental to protecting your capital and achieving target returns. The solar investment space presents unique challenges that differ significantly from traditional infrastructure assets, and sophisticated investors know that proper risk assessment separates winning portfolios from underperforming ones.
Development Risk: The First Hurdle
Development-stage projects carry the highest risk profile in the solar investment lifecycle. Permitting failures can derail projects entirely, often after significant capital has been deployed. Interconnection delays have become increasingly problematic, with queue times in some regions stretching to five years or more. Environmental challenges—from wetland restrictions to endangered species habitats—can add millions in mitigation costs or render sites completely unviable.
Smart investors mitigate these risks through thorough due diligence before committing capital. That means verifying site control documentation, reviewing preliminary interconnection agreements, and conducting comprehensive environmental assessments early in the process. You’ll want development partners with proven track records who’ve successfully navigated these obstacles before.
Technology and Equipment Risks
Solar panels will operate for 25 to 30 years, but not all manufacturers will survive that long. Equipment performance risk materializes when panels or inverters underperform their rated specifications. Manufacturer solvency matters tremendously—a warranty isn’t worth much if the company goes bankrupt five years into a project’s life.
Hudson Sustainable Group addresses these concerns through rigorous equipment selection criteria, favoring manufacturers with strong balance sheets and proven reliability metrics. We’ve learned from 25+ investments that upfront cost savings on equipment rarely justify the long-term performance risks.
Market and Revenue Risks
PPA counterparty credit risk represents one of the most significant exposures in contracted solar assets. If your offtaker defaults or declares bankruptcy, you’re suddenly exposed to merchant power prices. Merchant price exposure itself creates revenue volatility, particularly in markets without robust capacity markets. Basis risk—the mismatch between project location and pricing nodes—can erode projected returns in subtle but meaningful ways.
Portfolio diversification helps here. You don’t want concentration with a single offtaker or in one ISO region. Credit enhancement through parent guarantees or letters of credit provides additional protection for higher-risk counterparties.
Regulatory and Policy Shifts
Tax credit phase-downs create cliffs in project economics, though the Inflation Reduction Act has provided more stability than previous policy regimes. Still, changes to renewable portfolio standards at the state level can dramatically affect merchant power pricing and PPA values. The Right Approach To Climate And Energy Policy matters because policy frameworks directly impact asset valuations.
Investors should stress-test projects under various policy scenarios. What happens to your returns if tax credits decrease? How does the project perform if renewable energy credit prices collapse?
Operational Risks: The Long Game
Poor O&M quality will destroy returns over time. Equipment failures happen, but response times and repair quality vary dramatically across service providers. Force majeure events—from hurricanes to wildfires—pose location-specific risks that require careful evaluation.
Operational risk mitigation starts with selecting experienced O&M providers with strong performance histories. Performance-based contracts align incentives properly. Remote monitoring systems catch issues before they become expensive problems.
Financial Risk Management
Interest rate sensitivity affects project valuations and refinancing options. Most solar projects use significant leverage, making capital structure decisions critical. Sponsor default risk exists in portfolios where you’re co-investing with less-capitalized partners.
Hudson Sustainable Group’s risk mitigation framework incorporates several layers of protection. We structure development agreements that carefully allocate risks between sponsors and investors. EPC contracts include liquidated damages provisions and performance guarantees. O&M agreements contain availability guarantees with financial teeth.
Insurance as Risk Transfer
Comprehensive insurance strategies form another layer of protection. Construction insurance covers builder’s risk and delay-in-startup exposure. Operational insurance includes property coverage, business interruption, and liability protection. Performance guarantees from manufacturers provide additional downside protection.
The key is understanding that not all risks can be insured away. Some require acceptance, while others demand structural mitigation through contract terms and partner selection. After 25+ investments, we’ve developed a systematic approach that identifies which risks to transfer, which to mitigate, and which to price into our return expectations.
Regulatory Framework and Policy Considerations
Understanding the regulatory environment is absolutely essential when investing in solar farms. The policy framework shapes project economics, timelines, and ultimately, your returns.
Federal Incentives Drive Project Economics
The Investment Tax Credit (ITC) remains the most powerful federal incentive for solar development. Currently set at 30% through 2032, this credit allows investors to deduct 30% of their project costs directly from federal taxes. You’ll see this step down to 26% in 2033 and 22% in 2034 before settling at a permanent 10% for commercial projects.
Alternatively, utility-scale projects can elect the Production Tax Credit (PTC), which provides per-kilowatt-hour payments over the first ten years of operation. The PTC often makes more sense for larger facilities with strong production profiles.
The Inflation Reduction Act (IRA) transformed the clean energy tax incentive landscape in several significant ways. It extended the 30% ITC timeline and introduced bonus credits for meeting domestic content requirements or developing projects in energy communities. Projects using U.S.-manufactured components can receive an additional 10% credit, substantially improving returns.
State Policies Create Regional Opportunities
State-level regulations vary dramatically and directly impact your site selection strategy. Renewable Portfolio Standards (RPS) in states like California, New York, and Illinois mandate that utilities source specific percentages of electricity from renewable sources. These mandates create guaranteed demand for solar power.
Net metering policies and favorable interconnection standards in some states accelerate project approvals and revenue recognition. Meanwhile, other states maintain complex regulatory hurdles that can add 12-18 months to development timelines.
Interconnection: The Bottleneck You Can’t Ignore
Getting your solar farm connected to the grid often presents the biggest challenge. Interconnection queues have ballooned in recent years, with some projects waiting three to five years for utility approvals.
FERC Order 2023, implemented in 2023, aims to address these delays through improved queue management and study processes. However, you’ll still need to navigate regional transmission organization (RTO) requirements, which differ across MISO, PJM, ERCOT, and other grid operators. Budget for substantial interconnection deposits and anticipate potential upgrade costs if your connection point requires transmission improvements.
Environmental Compliance and Permitting
Environmental reviews can’t be shortcut. Projects typically require National Environmental Policy Act (NEPA) assessments, endangered species consultations under the Endangered Species Act, wetlands permits from the Army Corps of Engineers, and cultural resource surveys under the National Historic Preservation Act.
These reviews take time. Plan for 9-18 months of environmental documentation, though streamlined approaches exist for brownfield or previously disturbed sites. Projects near sensitive habitats or archaeological sites face additional scrutiny.
Community Engagement Matters
Successful developers don’t just check regulatory boxes—they build genuine community support. Community benefit agreements have become standard practice, particularly for larger installations. These might include property tax payments, local hiring commitments, agricultural land preservation funds, or direct community investment.
Opposition from local residents can derail even permitted projects. Early, transparent engagement with municipalities, agricultural stakeholders, and neighbors significantly reduces project risk.
International Considerations
For investors exploring opportunities beyond U.S. borders, regulatory frameworks vary enormously. Hudson Sustainable Group’s experience across 26 countries reveals that some markets offer feed-in tariffs with guaranteed long-term pricing, while others rely on competitive auctions. Each jurisdiction brings unique permitting requirements, grid connection standards, and incentive structures that demand localized expertise.
Due Diligence Framework for Solar Farm Investments
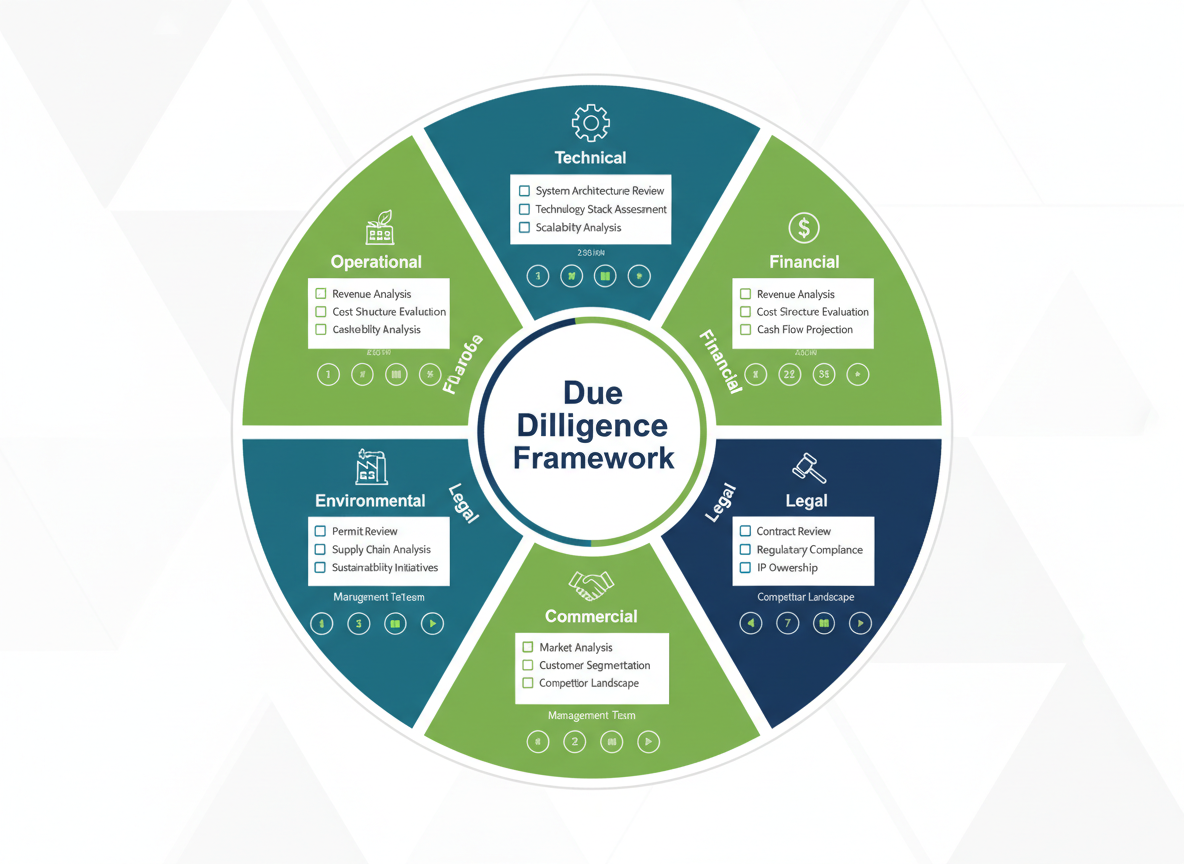
Walking away from a solar farm deal after spending $200K on due diligence feels painful until you realize the project would’ve lost $5 million. That’s the reality of institutional-grade investment analysis—thorough diligence isn’t an expense, it’s essential protection.
When you’re investing in solar farms at scale, cutting corners on due diligence is financial suicide. Here’s what sophisticated investors actually scrutinize before committing capital.
Technical Due Diligence: The Engineering Foundation
Independent engineer reviews form the backbone of technical analysis. You’ll want a third-party firm to model energy production independently, not simply rubber-stamp the developer’s projections. They’ll verify equipment specifications, review single-line diagrams, and assess whether that 30 MW project will actually generate its promised output.
Equipment verification goes beyond checking nameplates. Which module tier did the developer select? Are the inverters from manufacturers with established service networks? We’ve seen projects spec’d with second-tier equipment that looked fine on paper but created operational nightmares within 18 months.
The independent engineer should also evaluate geotechnical reports, interconnection studies, and construction risk. Their P50, P75, and P90 production estimates become the foundation for your financial modeling.
Financial Due Diligence: Following the Money
Cash flow modeling requires forensic attention. You’re not just validating assumptions—you’re stress-testing them. What happens if module degradation exceeds warranty specs? If electricity prices drop 15%? If the O&M costs inflate faster than projected?
Tax credit qualification deserves particular scrutiny now. Investment Tax Credits have specific eligibility requirements, and missing one detail can erase millions in expected value. Your tax counsel needs to verify that equipment meets domestic content requirements if those adders are modeled into returns.
Financing structure review is where many investors find surprises. Are there step-ups in the PPA pricing? What are the refinancing assumptions? Who has recourse if production underperforms?
Legal Due Diligence: Rights and Obligations
Title review and land rights verification can’t be outsourced to junior associates. Is that ground lease actually for 30 years with extensions, or does the option language have gaps? Are there unrecorded easements? We’ve seen deals where surface rights and mineral rights created unforeseen complications.
Contract assignment provisions matter enormously. Can you actually step into the developer’s shoes on that PPA? Does the EPC contract have assignment restrictions? Permitting status should show completed approvals, not just “applied for” or “anticipated.”
Commercial and Market Due Diligence
PPA credit analysis goes beyond checking the off-taker’s credit rating. You’re evaluating their long-term financial trajectory, industry exposure, and payment history. A utility facing regulatory challenges or a corporate buyer in a declining sector presents concentration risk.
Market price assumptions need validation against independent forecasts. If the project relies on merchant exposure after year 10, what do forward curves actually suggest?
Environmental and Insurance Reviews
Phase I and Phase II environmental assessments aren’t mere formalities. Contamination issues can halt projects indefinitely. Endangered species surveys have derailed developments that looked shovel-ready. Stormwater compliance affects both timelines and costs.
Insurance due diligence examines coverage adequacy across all phases—construction, operational, business interruption. Are the carriers rated A- or better? What’s the claims history telling you about project quality?
Operational Due Diligence
The O&M provider’s track record directly impacts your returns. How many facilities do they manage? What’s their response time for inverter failures? Asset management capabilities separate mediocre performance from optimized returns.
Red Flags That Stop Deals
Institutional investors walk when they see incomplete interconnection agreements, uncertain land control, off-takers with deteriorating credit, or developers unwilling to provide warranty assignments. These aren’t negotiable points—they’re deal-breakers.
Timeline and Investment
Expect comprehensive due diligence to take 60-120 days for substantial projects. Budget $100K-$300K for mid-sized facilities, potentially exceeding $500K for complex utility-scale developments. Hudson Sustainable Group’s investment approach demonstrates how thorough analysis protects capital while identifying genuine opportunities.
That investment in diligence? It’s the smartest money you’ll spend.
Power Purchase Agreements and Revenue Models
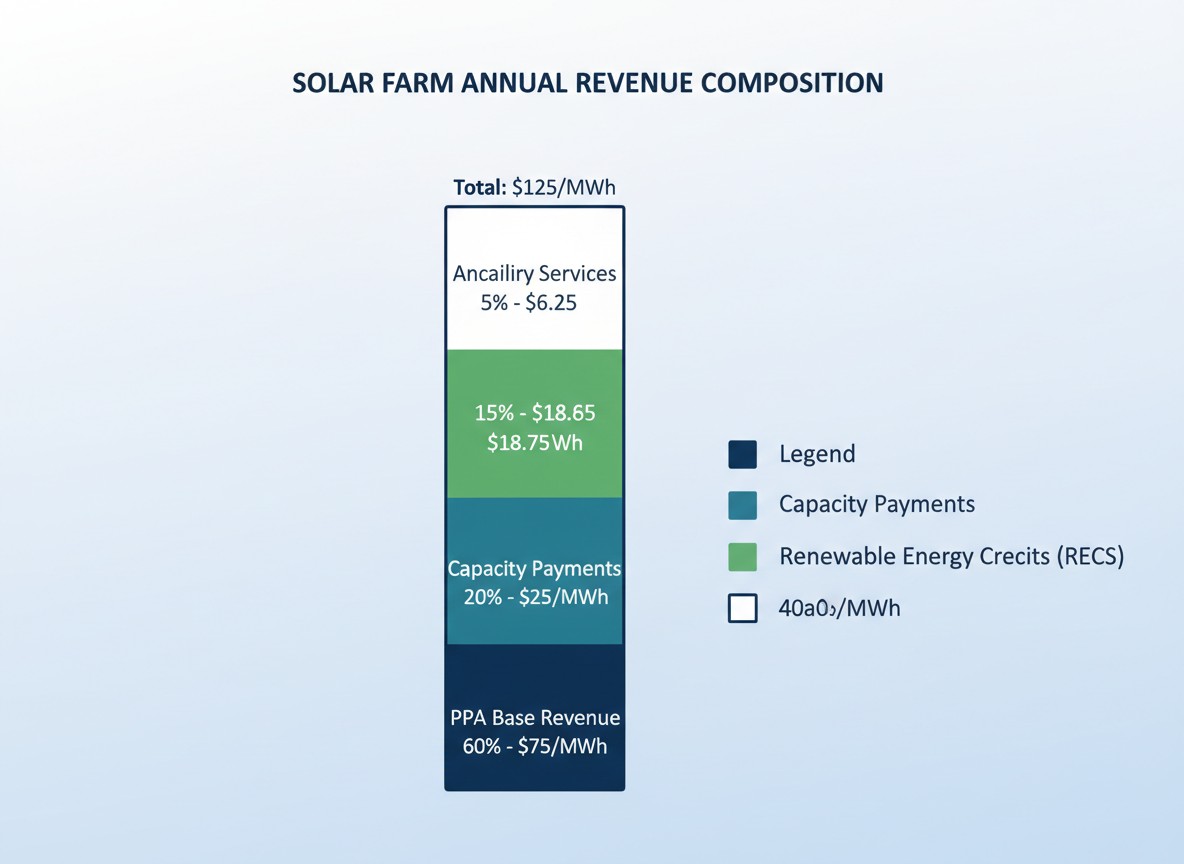
When you’re investing in solar farms, understanding how they generate revenue is non-negotiable. At the heart of most commercial solar projects sits the Power Purchase Agreement—a contract that determines everything from cash flow predictability to project bankability.
A PPA is essentially a long-term electricity sales contract between the solar farm owner and a buyer. These agreements typically span 15 to 25 years, creating the stable revenue foundation that makes solar projects attractive to institutional investors. The structure is straightforward: you generate electricity, the counterparty buys it at a predetermined rate, and everyone knows what to expect.
But here’s where it gets interesting—not all counterparties carry equal weight. Utilities have historically dominated as PPA buyers, offering reliable payment histories and strong credit profiles. Corporations have emerged as significant players, too, particularly tech giants and manufacturers chasing sustainability targets. Companies like Microsoft, Amazon, and Google have signed PPAs worth hundreds of megawatts. Municipalities round out the mix, though they require careful credit assessment since their financial stability varies considerably.
Creditworthiness matters more than you might think. A PPA with a BBB-rated corporate buyer won’t command the same financing terms as one backed by an A-rated utility. Smart investors dig into counterparty credit ratings, financial statements, and payment histories before committing capital.
Pricing structures come in two main flavors: fixed and escalating. Fixed-price agreements lock in a rate for the contract’s duration—simple, predictable, but you sacrifice upside potential. Escalating structures typically include 1-3% annual price increases, helping offset inflation and operational cost growth. Projects like Sky Solar demonstrate how well-structured agreements can deliver consistent returns while adapting to market dynamics.
Some investors accept merchant exposure, selling directly into wholesale markets without a PPA. This approach offers higher revenue potential when electricity prices spike but introduces significant volatility. Most institutional investors prefer blended strategies—securing 70-80% of output through PPAs while capturing merchant upside with the remainder.
Virtual PPAs have transformed corporate renewable procurement. Unlike physical PPAs where electricity flows directly to the buyer, VPPAs function as financial contracts-for-differences. The solar farm sells into the grid at market prices, then settles the difference with the corporate buyer based on the agreed strike price. This structure lets companies support renewables without geographical constraints.
Revenue extends beyond electricity sales. Renewable Energy Credits represent the environmental attributes of clean generation, and they’re separately marketable. In compliance markets like those in certain Northeast states, RECs can add 15-25% to project revenues. Voluntary markets offer lower prices but broader opportunities.
Ancillary services and capacity markets provide additional income streams. Solar farms can earn payments for grid stability services, frequency regulation, and maintaining available generation capacity. These revenue sources remain modest for most projects but they’re growing as grid operators value solar’s flexibility.
Negotiation leverage shifts with market conditions. When interconnection queues stretch for years and development sites are scarce, developers command better pricing. Oversupplied markets flip the equation, favoring buyers. Current trends show PPA prices ranging from $25-45/MWh for utility-scale solar, depending on location, resource quality, and contract terms.
Pay attention to termination provisions and credit support requirements. Most PPAs include force majeure clauses, performance guarantees, and early termination penalties. Buyers often require letters of credit or parent guarantees, tying up capital that could otherwise fund development. Understanding these provisions helps you model true project economics and avoid surprises that eat into returns.
Operations, Maintenance, and Asset Management
When you’re investing in solar farms, understanding operational costs separates realistic projections from fantasy. Utility-scale facilities typically run $8-$15 per kW annually for operations and maintenance, though this varies based on technology, climate, and contract structures. These costs might seem modest compared to initial capital outlays, but over a 25-year project life, they compound significantly.
The O&M world breaks down into two camps: preventive and corrective maintenance. Smart operators lean heavily toward prevention. Regular inspections catch inverter failures before they cascade. Thermal imaging identifies hot spots on panels. Electrical testing reveals connection degradation that could spark fires or system shutdowns. The best operators don’t wait for problems—they hunt them down proactively.
Modern solar facilities run on data. SCADA (Supervisory Control and Data Acquisition) systems track every panel string’s performance in real-time. You’ll know within minutes if production drops below expectations. These monitoring platforms generate massive amounts of data, and sophisticated asset managers use analytics to optimize performance across entire portfolios. They’re comparing sites, identifying underperformers, and allocating resources where they’ll generate the highest returns.
Vegetation management sounds unglamorous until you realize overgrown plants create shading losses that directly hit your bottom line. Mowing schedules, herbicide application, and weed barriers all require strategic planning. Similarly, security measures—fencing, cameras, motion sensors—protect against theft and vandalism. Copper wire theft remains surprisingly common at remote installations.
Panel cleaning deserves its own economic analysis. In dry, dusty regions like California’s Central Valley, regular cleaning can boost production 5-8%. In areas with frequent rain? You might skip cleaning entirely. The decision comes down to simple math: does increased production justify the labor and water costs?
Inverter replacement represents your largest long-term capital expense after initial construction. These workhorses typically need replacement around year 12-15, and you’d better have reserves set aside. Equipment manufacturers offer various warranty structures, but performance guarantees should include liquidated damages provisions. If your panels underperform specifications, you need compensation mechanisms built into contracts.
The First Solar 2 project exemplifies institutional-grade asset management, where ongoing operational excellence matters as much as initial development quality.
Remote monitoring and predictive maintenance technologies have transformed O&M economics. Machine learning algorithms now predict equipment failures weeks in advance. Drones equipped with infrared cameras inspect thousands of panels in hours rather than days. You’re seeing O&M providers integrate artificial intelligence to schedule maintenance before problems emerge.
Selecting an O&M provider requires scrutiny of technical capabilities, financial stability, and regional experience. Contract structures vary—some include performance guarantees, others operate on time-and-materials bases. The right choice depends on your risk tolerance and involvement level. Get this wrong, and your projected returns evaporate through operational inefficiency.
Case Study: Institutional Solar Farm Investment Success
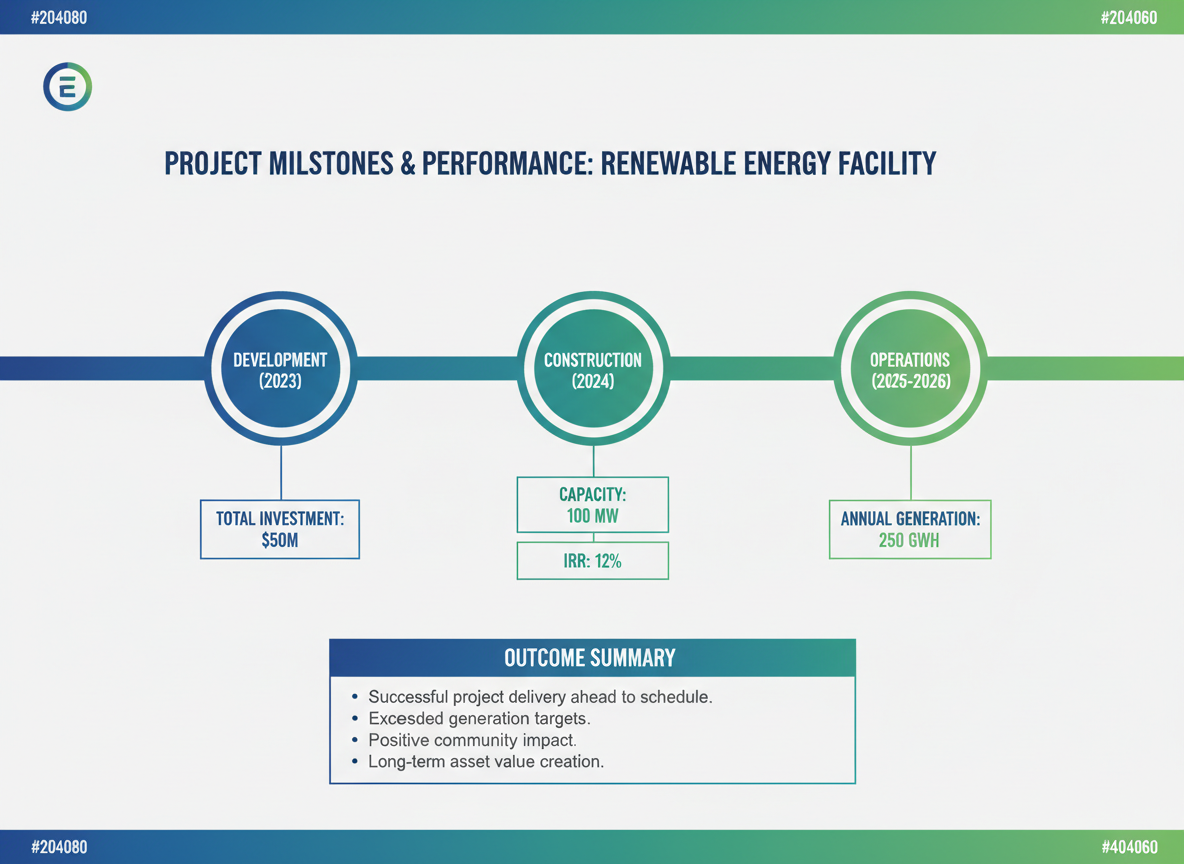
When a leading pension fund approached Hudson Sustainable Group in 2019 about investing in solar farms, they wanted more than theoretical projections—they needed a proven framework that could deliver stable returns while advancing their ESG commitments. What followed became a blueprint for institutional-grade solar investment.
Project Profile: Desert Sun Solar
The team identified a 100 MW utility-scale solar farm opportunity in Arizona’s high-irradiance corridor. This wasn’t just about favorable weather patterns. The site offered direct interconnection to existing transmission infrastructure, a creditworthy offtaker with investment-grade ratings, and local government support that streamlined permitting. These fundamentals mattered more than the sun itself.
The numbers tell part of the story: $85 million total project cost, structured with 40% equity and 60% non-recourse debt. But the real work happened in how Hudson architected the deal. They secured a 25-year power purchase agreement at favorable rates, negotiated developer fees that aligned incentives, and built in performance guarantees that transferred construction risk away from investors.
Development Timeline and Execution
Breaking ground took twelve months from site acquisition—faster than the industry average of eighteen to twenty-four months. Here’s what made the difference: Hudson’s team had already cultivated relationships with equipment suppliers, securing module pricing before tariff uncertainties emerged. They’d pre-qualified contractors who understood the site’s unique geological considerations. When monsoon season threatened to delay foundation work, the construction team had built enough buffer into the schedule to absorb the setback.
The facility achieved commercial operation in March 2021, within budget and on schedule. That consistency isn’t glamorous, but it’s what institutional investors pay for.
Financial Performance and Returns
Three years in, the actual numbers have exceeded pro forma expectations. The project delivered a 13.2% gross IRR, outperforming the initial 11.8% projection. Cash-on-cash returns hit 9.7% annually, providing the steady distribution cadence the pension fund required for its liability matching strategy.
Tax equity monetization proved particularly effective. Investment Tax Credit benefits generated $25.5 million in value, while accelerated depreciation schedules enhanced after-tax returns by an additional 180 basis points. These weren’t hypothetical tax strategies—they were real dollars returned to investors.
Risk Management in Practice
Not everything went perfectly. Year two brought an inverter failure that reduced production by 4% for three weeks. But because Hudson had structured comprehensive operations and maintenance agreements with manufacturer warranties, repair costs didn’t touch investor returns. The insurance claim processed smoothly, and the performance guarantee kicked in to compensate for lost revenue.
This is where deal structure earns its keep. The risk mitigation framework built into the project absorbed real-world problems without derailing returns.
Exit Strategy and Investor Returns
In early 2024, Hudson executed a strategic exit, selling the asset to a European infrastructure fund seeking established renewable assets. The sale price reflected the project’s proven performance track record and contracted revenue stream. Investors realized a 2.3x equity multiple over the hold period, with total distributions exceeding initial projections by 18%.
The pension fund has since committed to three additional projects using the same investment framework. You can explore how this approach scales across Hudson’s diverse renewable energy portfolio.
Replicable Success Factors
What made Desert Sun Solar work wasn’t luck. It was rigorous site selection, conservative financial modeling, alignment of interests across all parties, and operational excellence during the hold period. Hudson’s pioneering financing models don’t rely on subsidy arbitrage or speculative energy price assumptions. They’re built on bankable fundamentals that work across market cycles—the kind of approach that turns first-time solar investors into repeat partners.
Investment Entry Points and Partnership Opportunities
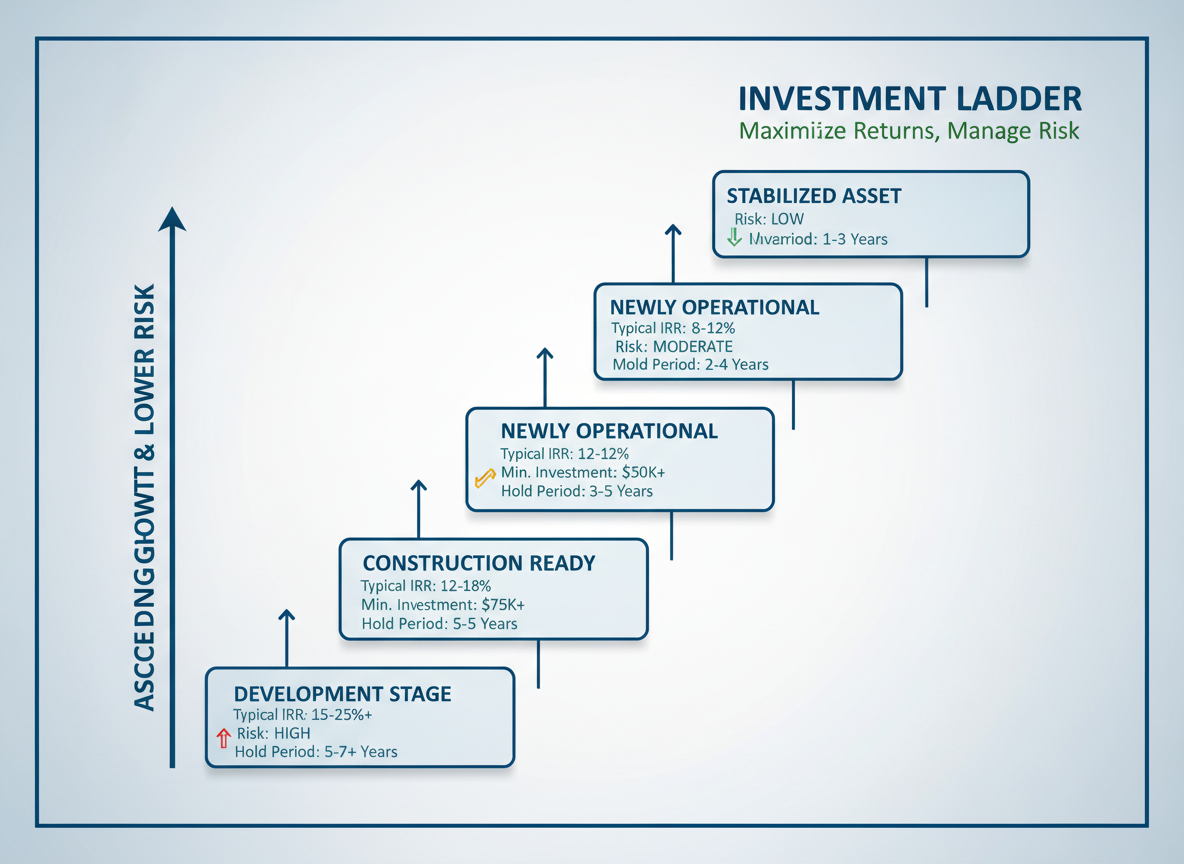
The spectrum of opportunities for investing in solar farms spans multiple entry points, each with distinct risk-return profiles and capital requirements. Understanding where to enter this market depends on your investment timeline, risk tolerance, and operational expertise.
Development-Stage vs. Operating Assets
Development-stage projects offer the highest potential returns—often targeting 15-20% IRR—but come with permitting, interconnection, and execution risks. You’re essentially betting on a sponsor’s ability to navigate regulatory hurdles and secure offtake agreements. Construction-ready projects sit in the middle ground, with secured permits and interconnection rights but pre-operational uncertainty. These typically target 12-15% returns.
Operating solar farms represent the lower-risk entry point. With cash flows already generating and performance data available, these stabilized assets appeal to institutions seeking predictable returns in the 8-12% range. The trade-off is straightforward: you’re paying for de-risked cash flows rather than capitalizing on development value creation.
Minimum Investment Thresholds
Entry requirements vary dramatically by structure. Direct asset acquisitions typically demand $10-50 million minimums, putting them out of reach for many individual investors. Co-investment vehicles with established sponsors like Hudson Sustainable Group often set thresholds at $1-5 million, providing access to institutional-grade dealflow without requiring full project capitalization.
Fund structures further democratize access. Closed-end funds focused on solar infrastructure commonly accept commitments starting at $250,000-$500,000 from qualified purchasers. These funds typically have 7-10 year terms and target blended returns across development, construction, and operating phases.
Platform vs. Single-Asset Strategies
Platform investments offer diversification that single-asset plays can’t match. By partnering with developers building multiple projects, you’re spreading construction risk, geographic exposure, and offtaker concentration. Hudson Sustainable Group’s platform approach across 26 countries exemplifies this model—you’re investing in organizational capability and pipeline, not just one project’s success.
Single-asset investments make sense when you’ve identified exceptional fundamentals: a long-term corporate PPA, prime solar resource, and experienced local operators. Just recognize you’re taking concentrated risk on one site’s performance.
Fund Structures and Returns
Closed-end funds remain the dominant structure for solar farm investments. They provide defined capital deployment periods (typically 3-4 years) followed by harvest periods. Target returns range from 10-14% net IRR for diversified portfolios, with vintage year significantly impacting performance based on equipment pricing and ITC availability.
Open-end funds, though less common in renewable energy, offer liquidity advantages. They allow capital deployment and redemptions at regular intervals, appealing to investors who want exposure without long lock-up periods. Returns tend to be lower—8-10%—reflecting the liquidity premium.
Joint Ventures and Direct Partnerships
Sophisticated investors increasingly pursue direct developer partnerships through joint venture structures. These arrangements split equity ownership—often 20-40% to the investor—while the developer manages construction and operations. You’ll gain more control and transparency than passive fund investments, though you’ll need expertise to negotiate favorable terms and monitor performance.
Secondary Market Opportunities
The maturing solar sector has created an active secondary market. Institutional investors occasionally sell operating assets for portfolio rebalancing, creating acquisition opportunities. These transactions typically involve assets with 3-10 years of operating history, proven production data, and established cash flows. Pricing reflects actual performance rather than projections, reducing uncertainty.
Diversification Strategies
Spreading capital across different geographies mitigates weather risk and policy uncertainty. Combining utility-scale solar with community solar, or pairing solar-plus-storage projects with standalone generation, creates portfolio resilience. The most sophisticated investors also diversify across investment stages, balancing stable income from operating assets with growth potential from development platforms.
Environmental Impact and Sustainability Metrics
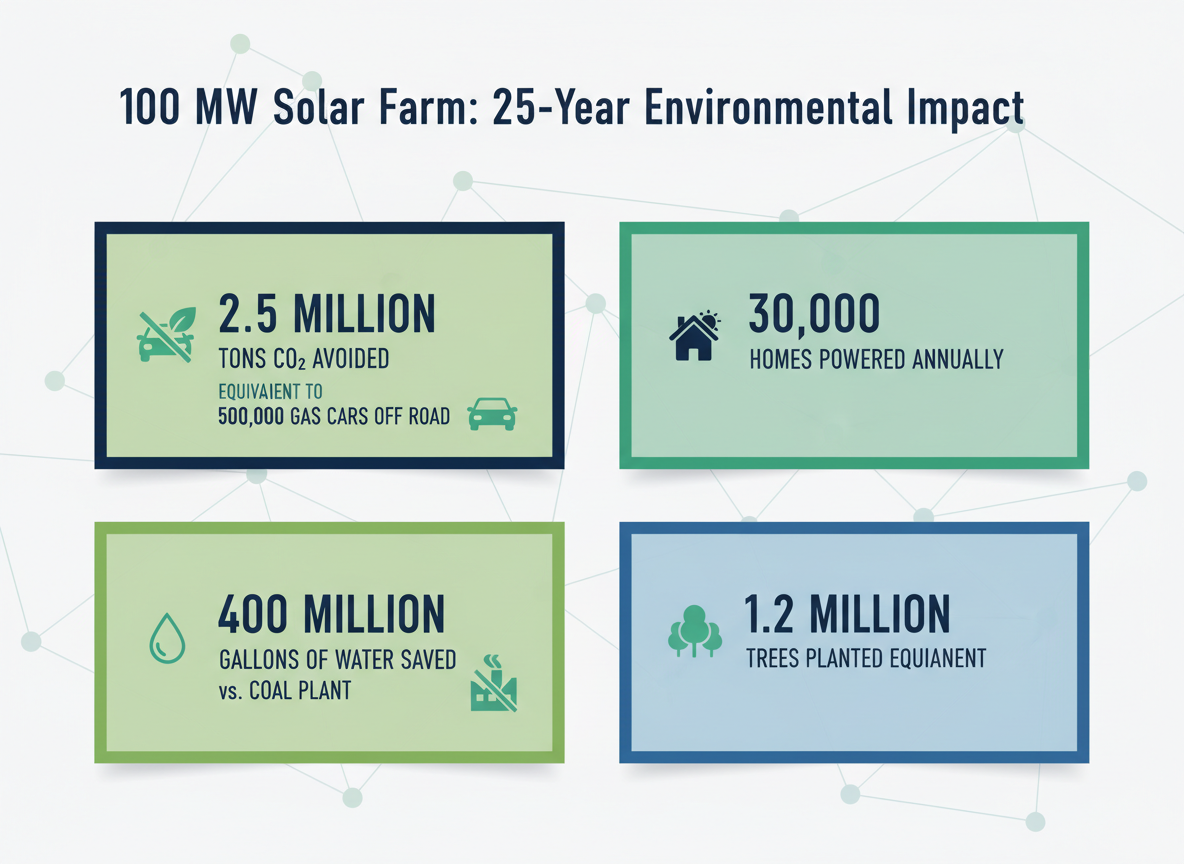
When investing in solar farms, understanding the environmental impact isn’t just about checking a box—it’s about quantifying real-world benefits that increasingly drive capital allocation decisions and regulatory compliance.
Measuring Carbon Avoidance
A typical 100 MW solar farm avoids more than 150,000 tons of CO2 equivalent emissions annually compared to fossil fuel generation. That’s roughly equal to removing 32,000 cars from the road each year. These calculations vary by region, depending on what your solar farm displaces in the local grid mix. In coal-heavy markets, the carbon avoidance multiplies significantly.
Life cycle environmental assessments tell a more complete story. While solar panel manufacturing does create emissions, the energy payback period averages 1-2 years. With operational lifespans exceeding 25 years, the net environmental benefit is overwhelmingly positive.
Smart Land Use Strategies
Land use often sparks legitimate concerns, but innovative approaches are reshaping the conversation. Agrivoltaics—combining solar generation with agriculture—allows sheep grazing, pollinator habitats, or shade-tolerant crops beneath and between panel rows. Some projects generate dual revenue streams while actually improving soil health.
Site selection matters enormously. Brownfield redevelopment, closed landfills, and degraded agricultural land offer opportunities that avoid displacing productive ecosystems or farmland. These sites often come with additional incentives and smoother permitting processes.
Water and Resource Efficiency
Solar’s water consumption advantage is substantial. While coal and natural gas plants require massive water volumes for cooling, solar photovoltaic systems need only occasional panel washing—and some operators use waterless cleaning methods. In water-stressed regions, this benefit can’t be overstated.
Conventional thermoelectric power plants withdraw 41 billion gallons of water daily in the U.S. alone. Solar farms effectively eliminate this burden while generating clean electricity.
Biodiversity and Habitat Considerations
Modern solar development incorporates comprehensive biodiversity impact mitigation from day one. Pre-construction environmental assessments identify sensitive species and habitats. Smart design includes wildlife corridors, native vegetation restoration, and seasonal construction restrictions.
Many solar farms have become unexpected biodiversity havens. Pollinator-friendly plantings beneath panels support declining bee populations while reducing maintenance costs. Ground-nesting bird species often thrive in well-managed solar sites.
Circular Economy Planning
End-of-life panel management is shifting from future concern to current planning priority. The solar recycling industry is maturing rapidly, with facilities recovering 95% of silicon, glass, and metals from decommissioned panels. Forward-thinking investors now include detailed decommissioning and recycling provisions in project planning.
ESG Reporting Frameworks
Institutional investors need standardized sustainability metrics. Solar farm investments align naturally with major ESG frameworks including GRI (Global Reporting Initiative), SASB (Sustainability Accounting Standards Board), and TCFD (Task Force on Climate-related Financial Disclosures).
These frameworks provide consistent, comparable data that satisfies fiduciary requirements and sustainability mandates. For pension funds and endowments facing pressure to decarbonize portfolios, solar investments offer transparent impact measurement.
Portfolio Decarbonization
Solar assets directly address portfolio decarbonization goals while maintaining competitive returns. Many institutional investors target net-zero portfolios by 2040 or 2050. Solar infrastructure investments contribute significantly to these targets without sacrificing financial performance.
The connection between renewable energy investment and effective climate policy continues strengthening as more institutions recognize that environmental responsibility and financial prudence aren’t mutually exclusive—they’re increasingly interdependent.
Market Outlook and Future Investment Opportunities
The momentum behind investing in solar farms shows no signs of slowing. U.S. solar capacity is expected to triple by 2030, with projections reaching 500 GW of installed capacity. Globally, the numbers are even more striking—analysts forecast 2.5 TW of new solar installations through the end of the decade. That’s roughly equivalent to building today’s entire global solar infrastructure three times over.
These aren’t just aspirational targets. They’re backed by economic fundamentals that have permanently shifted in solar’s favor.
Technology Innovations Reshaping Returns
The next generation of solar technology is arriving faster than most investors realize. Bifacial modules, which capture sunlight on both sides, already deliver 10-15% more energy than traditional panels at minimal additional cost. Meanwhile, perovskite solar cells promise to push conversion efficiencies above 30%, potentially revolutionizing economics for space-constrained projects.
But the real transformation is happening at the system level. Energy storage integration has moved from novelty to necessity. Solar-plus-storage projects now represent the fastest-growing segment of new utility-scale deployments, fundamentally altering both revenue profiles and grid value propositions. Battery costs have dropped 90% over the past decade, making four-hour storage systems economically viable across most markets.
Corporate Procurement Drives Sustained Demand
Corporate renewable energy procurement has become a structural demand driver that’s often overlooked. Companies purchased over 30 GW of clean energy in 2023 alone, with tech giants, manufacturers, and retailers signing increasingly ambitious commitments. These long-term corporate PPAs provide exactly the kind of stable, creditworthy offtake that institutional investors favor when investing in solar farms.
Amazon, Google, and Microsoft have each committed to 100% renewable energy—targets that require tens of gigawatts of new capacity. This corporate appetite creates a parallel market alongside traditional utility procurement, often with more favorable terms and longer contract durations.
Geographic Opportunities Across Markets
Domestic U.S. markets remain highly attractive, particularly in Texas, California, and the Southeast, where grid constraints and growing demand create premium pricing opportunities. The Inflation Reduction Act has unlocked previously challenging markets by making projects economically viable in lower-irradiance regions.
Internationally, opportunities continue expanding. Hudson Sustainable Group’s work across 26 countries, as discussed during Neil Auerbach’s participation at Global Energy Meet 26, demonstrates how diverse markets offer distinct risk-return profiles. Japan’s feed-in tariff programs, Europe’s renewable mandates, and emerging markets’ electrification needs each present compelling investment cases.
Emerging Investment Themes
Virtual power plants represent perhaps the most intriguing next-generation opportunity. By aggregating distributed solar and storage assets, VPPs create grid services that command premium compensation while reducing infrastructure costs. Early movers in this space are capturing value streams that didn’t exist five years ago.
Green hydrogen integration is moving from concept to commercial reality. Solar farms with dedicated electrolyzer capacity can access new revenue sources while contributing to hard-to-decarbonize sectors like heavy industry and shipping.
Institutional Capital Accelerates Transition
Perhaps the most significant shift is institutional capital’s growing allocation to renewable infrastructure. Pension funds and sovereign wealth funds now view solar as core infrastructure—stable, predictable, and essential. This rerating has compressed yields while expanding available capital, creating a virtuous cycle that accelerates deployment.
The competitive landscape is consolidating around sophisticated operators who can navigate complex markets, optimize technology deployment, and deliver institutional-grade returns. As the industry matures, experience and execution capability increasingly separate winners from stragglers.
For investors, the question isn’t whether solar presents opportunities—it’s which opportunities best align with their risk tolerance, return requirements, and impact objectives.
Conclusion: Capitalizing on Solar Farm Investment Opportunities
The opportunity for investing in solar farms has matured into a compelling asset class that delivers institutional-grade returns alongside measurable environmental impact. What began as a niche corner of alternative energy has evolved into a sophisticated investment sector characterized by proven cash flows, declining technology costs, and unprecedented corporate demand for renewable energy.
Success in this space isn’t accidental. It requires a calculated approach to managing development risk, structuring financial instruments that align with project economics, and maintaining operational excellence throughout decades-long asset lifespans. The investors who generate exceptional returns understand that solar farms demand the same analytical rigor as traditional infrastructure investments—perhaps more so, given the technical complexity and evolving regulatory landscape.
The beauty of solar farm investments lies in their flexibility. Whether you’re an institutional investor seeking stable, long-term yields through operational assets, or a family office willing to accept development risk for enhanced returns, there’s an entry point that matches your risk tolerance and capital position. Ground-up development projects, yieldco structures, tax equity partnerships, and secondary market acquisitions each serve different investment objectives.
Several powerful forces support the long-term investment thesis. Federal policy through the Inflation Reduction Act provides unprecedented clarity and generosity. State-level renewable portfolio standards create predictable demand. Corporate sustainability commitments translate into bankable offtake agreements. These aren’t temporary trends—they represent fundamental shifts in how America generates and consumes electricity.
Due diligence can’t be an afterthought. Site assessment, interconnection risk, offtake counterparty strength, EPC contractor capabilities, and operational maintenance plans all require thorough vetting. Partnering with experienced renewable energy investors who’ve navigated full market cycles isn’t just advisable—it’s essential for optimizing outcomes.
Hudson Sustainable Group’s track record speaks directly to this point. Our deployment of over $13 billion across renewable energy projects, consistently delivering IRRs exceeding 31%, demonstrates what’s achievable with the right approach. This performance stems from disciplined underwriting, strategic relationships across the value chain, and operational capabilities that maximize long-term asset value.
The energy transition isn’t slowing down. Solar technology continues advancing while costs decline. Grid infrastructure modernization accelerates. Storage solutions reach economic viability. For investors who understand the fundamentals and approach this sector with appropriate sophistication, solar farms offer a rare combination: attractive financial returns and positive environmental legacy.
Ready to explore how your capital can participate in this transformation? Discover partnership opportunities with proven renewable energy investors who combine deep market expertise with demonstrated execution capabilities. Solar farms remain the cornerstone of forward-thinking sustainable investment portfolios.
Frequently Asked Questions
What is the minimum investment required for solar farm investments?
Entry points vary significantly based on your investment approach. Solar-focused funds typically accept minimum investments starting around $500,000 to $1 million, making them more accessible for qualified investors looking to diversify across multiple projects. Direct co-investments in individual solar farms generally require substantially more capital—usually $5 million to $25 million or higher—depending on project size and ownership structure. Some publicly traded solar REITs and yieldcos offer the lowest barriers to entry, with investments starting at regular share prices, though these provide less direct exposure to specific projects. Family offices and institutional investors often find that direct investments in utility-scale facilities, while requiring more capital upfront, deliver better control and transparency.
What are typical returns for solar farm investments?
Returns depend heavily on project stage and risk profile. Stabilized, operational solar farms with long-term power purchase agreements typically deliver 8% to 15% annual returns through predictable cash flows over 20-30 years. Development-stage projects carry higher risk but can generate 15% to 25%+ returns for investors willing to navigate permitting, interconnection, and construction phases. Several factors influence these numbers: PPA pricing, equipment costs, financing terms, location-specific solar irradiance, operating efficiency, and available tax incentives. Portfolio investments that blend operational assets with development opportunities often target mid-teens returns while managing risk across different project stages.
How long does it take to develop a solar farm from start to finish?
You’re looking at 24 to 48 months for most utility-scale projects, though timelines vary considerably. Site selection and land acquisition might take 3-6 months. Securing interconnection agreements and navigating the utility queue can stretch 12-24 months—often the longest phase. Permitting and environmental reviews typically require 6-12 months, depending on local regulations and community engagement. Once you’ve cleared those hurdles, construction itself is relatively quick at 6-12 months for most projects. The wild card? Interconnection backlogs in many markets have pushed timelines beyond historical norms, sometimes adding years to development schedules.
What are the main risks in solar farm investing?
Development risk tops the list—you’ll face potential setbacks with permitting delays, interconnection issues, community opposition, or site complications. Technology risk includes equipment performance, manufacturer warranties, and panel degradation rates (though modern panels have strong track records). Market risk comes from power price fluctuations, especially for merchant projects without PPAs. Regulatory changes can affect tax incentives, renewable energy credits, or grid policies. Operational risks include equipment failures, weather events, or underperformance relative to projections. That said, experienced sponsors with diversified portfolios effectively manage these risks through careful due diligence, professional operation and maintenance, and sophisticated insurance products.
How do solar farms generate revenue?
Most commercial solar farms generate the bulk of their revenue through power purchase agreements—long-term contracts (typically 15-25 years) with utilities or corporate offtakers that establish fixed or escalating electricity prices. These PPAs provide cash flow predictability that makes projects bankable. Some facilities sell power at wholesale market rates (merchant sales), accepting price volatility for potentially higher returns. Renewable energy certificates represent a secondary revenue stream, monetizing the environmental attributes separately from the electricity itself. Many projects combine these approaches—perhaps a 15-year PPA covering 80% of production with merchant exposure for the remainder. Contract structures vary, but creditworthy offtakers and well-structured PPAs form the foundation of most institutional-quality investments.
What tax benefits are available for solar farm investors?
The Investment Tax Credit remains the cornerstone benefit, currently offering 30% of project costs as a direct credit under the Inflation Reduction Act. This credit can be taken upfront at commercial operation or transferred to other taxpayers—an option that’s opened new investment structures. Modified Accelerated Cost Recovery System allows accelerated depreciation over five years, creating significant early-year tax shields. The IRA also introduced production tax credits as an alternative to the ITC, plus bonus credits for domestic content and projects in energy communities. Partnership structures typically pass these benefits through to investors with sufficient tax appetite, while tax equity investors specifically seek these advantages.
How much land is needed for a commercial solar farm?
Plan for roughly 5-10 acres per megawatt of capacity, depending on panel efficiency, mounting system, and site layout. A 100 MW facility might occupy 600-800 acres, including setbacks, access roads, and equipment spacing. Beyond raw acreage, site selection matters enormously. You’ll want relatively flat terrain (or gentle slopes), limited shading, strong solar resources, proximity to transmission infrastructure, and compatible zoning. Soil conditions affect foundation costs, while vegetation management impacts ongoing operations. Many developers now pursue dual-use arrangements—agrivoltaics where sheep grazing or pollinator habitats coexist with solar panels—maximizing land value and community benefits.
What is Hudson Sustainable Group’s experience with solar investments?
We’ve deployed more than $13 billion across 26 countries, building a portfolio that includes solar investments alongside broader renewable infrastructure. Our portfolio company HSPC demonstrates our commitment to utility-scale renewable development and operational excellence. This global footprint provides unique insights into different market dynamics, regulatory frameworks, and technology applications across diverse geographies. Our approach combines financial discipline with mission-driven sustainability impact, backed by institutional-grade due diligence and active asset management throughout project lifecycles.
Can solar farms be profitable without subsidies?
Absolutely—in fact, solar has largely reached grid parity in many markets. Unsubsidized solar now competes directly with conventional generation in regions with strong solar resources and supportive market structures. Bloomberg NEF analysis shows solar as the cheapest new electricity source across two-thirds of the world. That doesn’t mean incentives aren’t valuable; they improve returns and accelerate deployment. But the underlying economics have fundamentally shifted. Solar farms win corporate PPAs and merchant market competitions on pure price competitiveness, not just environmental benefits.
What happens to solar panels at end of life?
Quality panels typically deliver productive output for 25-30 years, with gradual degradation rather than sudden failure. Industry recycling programs recover valuable materials—silicon, glass, aluminum, copper—with recovery rates exceeding 90% for many components. Decommissioning plans, often required during permitting, ensure responsible panel removal and site restoration. Some projects extend operations beyond initial projections through panel replacements or repowering, while others convert sites to newer technology. The growing recycling infrastructure addresses concerns about panel waste, turning end-of-life management from a liability into an opportunity for material recovery and circular economy principles.